
 Stephanie Ferguson
Director, Global Employment Policy & Special Initiatives, U.S. Chamber of Commerce
 Isabella Lucy
Graphic Designer, U.S. Chamber of Commerce
Published
July 12, 2023
A national crisis by the numbers
Right now, there are too many jobs without people to fill them. As a result, businesses can’t grow, compete, and thrive. The U.S. Chamber and Chamber Foundation's America Works initiative is mobilizing business and government to swiftly address the crisis.
This page captures the trends on job openings, labor force participation, quit rates, and more, for a quick understanding of the state of the workforce. Take a look behind the numbers at what is causing the worker shortage and learn which states and industries have been impacted the most.
The U.S. has lost millions of workers.
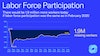
- 62.6%labor force participation rate
- 1.9Mworkers are missing from the labor force compared to Feb. 2020
The latest jobs report from the Bureau of Labor Statistics showed that thousands of people are entering the workforce. This is good. However, labor force participation does not match what it was before the pandemic.
If the percentage of people participating in the labor force was the same as in February 2020, we would have 1.9 million more people in the workforce today—and this shortage is impacting all industries in nearly every state. If every unemployed worker took an open job in their industry, there would still be millions of open jobs.
Where did the workers go? During the COVID-19 pandemic, early retirements and less immigration has left the nation in a worker deficit. Plus, boosted unemployment benefits, stimulus payments, and child tax credits during offered during the pandemic padded the finances of some previously employed workers, and they no longer need to work, or in some cases people have adjusted to a single-income household lifestyle.
- Analysis: Learn the industries impacted the most
- Download the Data: America Works Data

We have a lot of jobs, but not enough workers.
- 9.8Mopen jobs in the U.S.
- 5.9Munemployed workers in the U.S.
If every unemployed person in the country found a job, we would still have 4 million open jobs.
How did this happen? At the height of the pandemic, more than 120,000 businesses temporarily closed, and more than 30 million U.S. workers were unemployed. Since then, job openings have continued to climb, while unemployment has slowly declined.
- Analysis: Learn the reasons behind the worker shortage
- Download the Data: America Works Data

The gap between open jobs and unemployed individuals is wide, but slowly narrowing. High inflation is driving down savings accounts Americans built up over the pandemic, driving a need for many to return to the workforce. On the other hand, businesses that staffed up heavily during the pandemic are now re-adjusting to the new normal pace. That has resulted in some layoffs and a slowing in hiring in certain industries. But those situations are not representative of the broader job market.
Most states are feeling the impact of the worker shortage.
- 75workers for every 100 open jobs in the U.S.
- 38workers for every 100 open jobs in North Dakota
The Chamber’s Worker Shortage Index number indicates the number of available workers for every job opening. The Chamber calculates the Worker Shortage Index using the number of unemployed workers and the number of people who are marginally attached to the labor force. The Bureau of Labor Statistics (BLS) defines marginally attached individuals are those who are not considered to be part of the labor force, but want to, and are available, to work.
North Dakota, with the lowest ratio of 0.38, is suffering the most and finding workers is proving challenging for businesses, especially in rural areas. Washington, New York, California, and Nevada currently have a Worker Shortage Index above 1, meaning the states have a higher number of available workers than job openings.
- Analysis: Visit our interactive state map tracking the worker shortage
- Download the Data: America Works Data


The Great Resignation is more like ‘The Great Reshuffle’
- 3.8%national quit rate
- 4.0%national hiring rate
The Great Resignation has pulsed through media headlines. However, ‘The Great Reshuffle’ is a more accurate explanation of the changes taking place in the workforce. The rate at which employees quit their jobs grew drastically since November 2020, but is trending downward. At the same time, hiring continues to outpace quits. High quit rates coupled with even higher hiring rates shows that workers are leaving their current employer for a new one – often in search of higher pay, more growth opportunities, or a change in industry and culture.
- Analysis: Learn the reasons behind the worker shortage
- Download the Data: America Works Data

Job openings have largely increased in most states since February 2020.
- Georgiahighest percent increase in job openings
Every state has more job openings today than it had before the pandemic. Job openings are slowing down in some states, but Georgia, Colorado, New Mexico, and Nevada have had an increase in job openings by 70% or more between February 2020 and June 2023. States on average had a 41% job opening increase from February 2020 to March 2023 – a sign that businesses are still creating jobs across the nation.
Prior to the pandemic, 11 states had more than 200,000 job openings. That number has grown to 16 states as of March 2023. Sixteen states had fewer than 50,000 vacant jobs just prior to the pandemic. Now, that number has shrunk to 12.
- Analysis: Visit our interactive state map tracking the worker shortage
- Download the Data: America Works Data

The Great Reshuffle has affected some industries more than others.
- 4.8%quit rate for leisure and hospitality industry
- 1.5%quit rate for the financial activities industry
The Great Reshuffle has affected some industries more than others. Workers in traditionally lower paying industries, including leisure and hospitality and retail, have been most likely to quit their jobs. Meanwhile, in more stable, higher paying industries, the number of employees quitting has been lower.
- Analysis: Learn the industries impacted the most
- Download the Data: America Works Data

Employers are responding quickly to the worker shortage, deploying new strategies to attract and retain a talented workforce. As the labor market continues to shift, and workers obtain new skills to gain employment in different industries, our labor pools take different shapes.
Workers in industries that require specialized skills or training, like financial activities and durable goods manufacturing, are experiencing relatively low unemployment rates. Conversely, workers in industries that offer a large number of entry level jobs—leisure & hospitality and wholesale & retail trade—have unemployment rates greater than the national average.

Hourly pay has leveled out.
Worker shortages, unfilled jobs, and inflation are impacting not just employers, but employees, too. As labor market demand shifts, so does pay. Hourly pay increased across the board in the summer of 2021 and spring of 2022 but has since leveled out over the course of summer 2023.

The Instawork Pay Signal Index shows the change in business’s hourly pay. Readings below 50 indicate more businesses lowering wages than raising them, and the opposite for readings above 50.
Through the America Works Initiative, we’re helping employers across the country develop and discover talent to fill open jobs and grow our economy. For more information on the America Works Initiative contact Jenna Shrove at jshrove@uschamber.com.
Read More


About the authors
Stephanie Ferguson


